![]()
![]()

HOME > Investor relations > Financial Highlights (Consolidated)
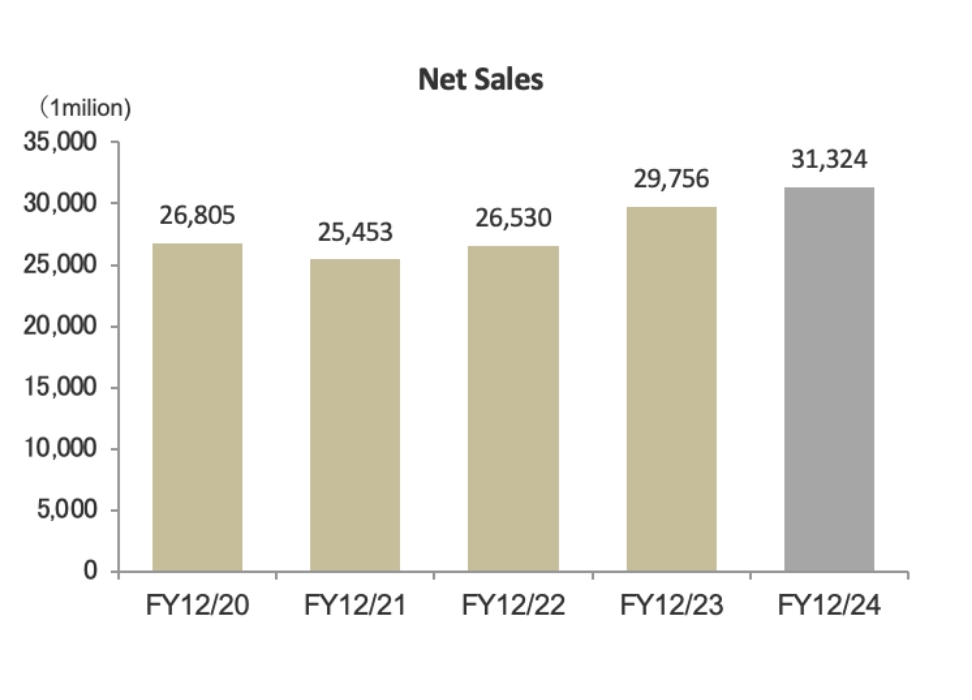
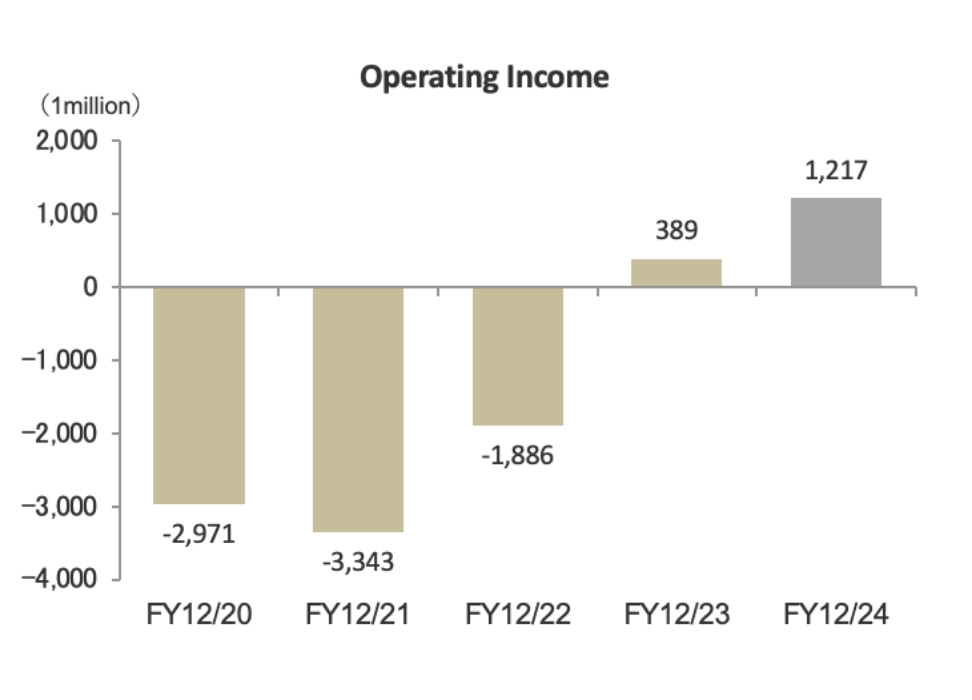
| FY12/21 | FY12/22 | FY12/23 | FY12/24 | FY12/25 | Net Sales | 25,453 | 26,530 | 29,756 | 31,324 | 31,932 | Operating Income | -3,343 | -1886 | 389 | 1,217 | 725 |
|---|---|---|---|---|---|
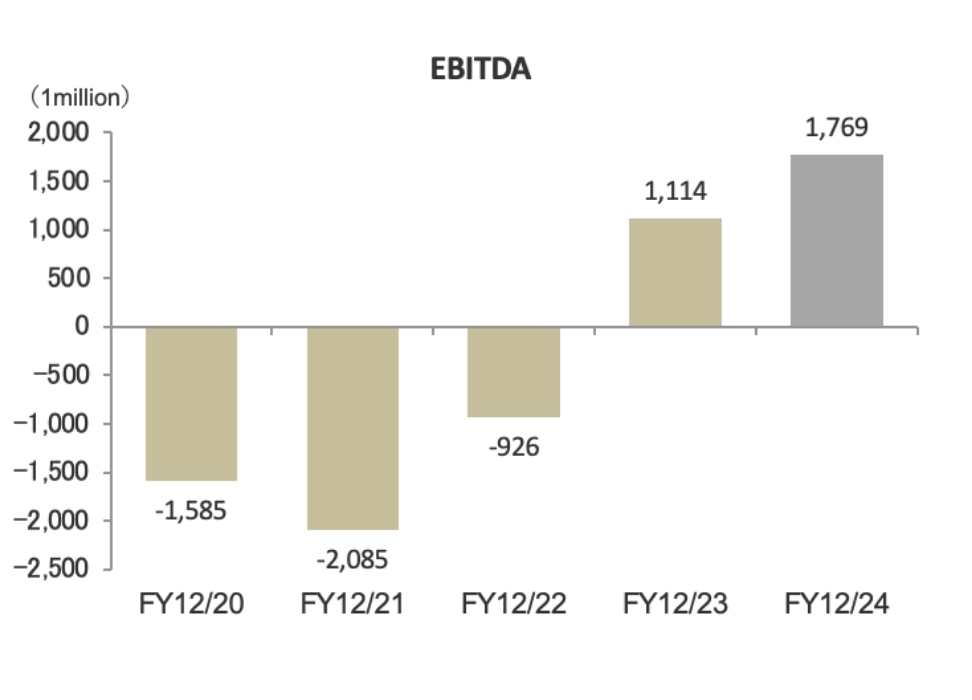
| EBITDA | -2,085 | -926 | 1,114 | 1,769 | 1,280 |
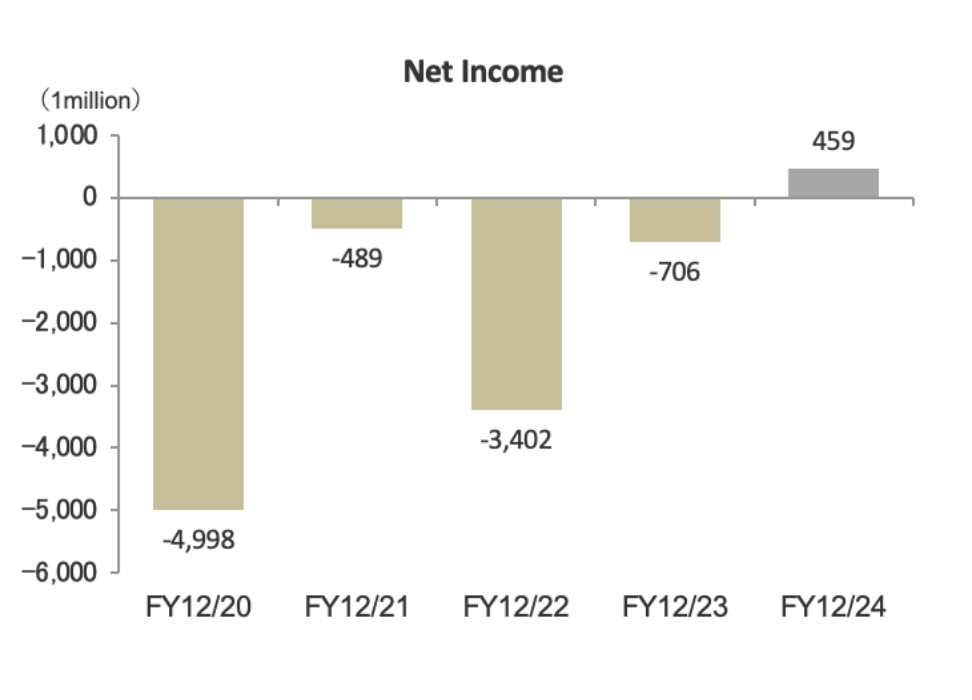
| Net Income | -489 | -3402 | -706 | 459 | 90 |
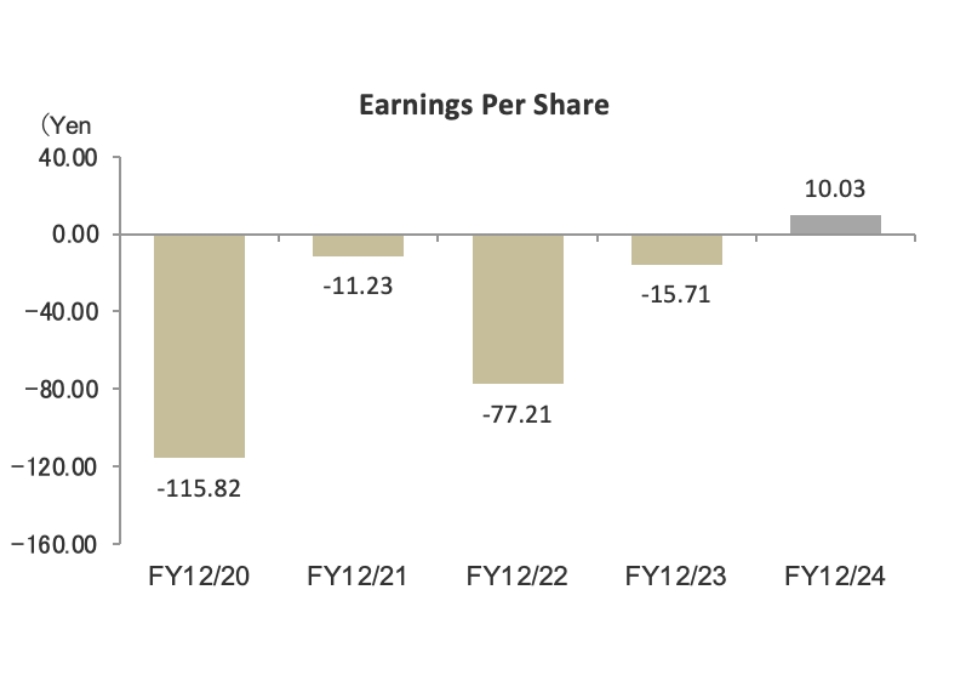
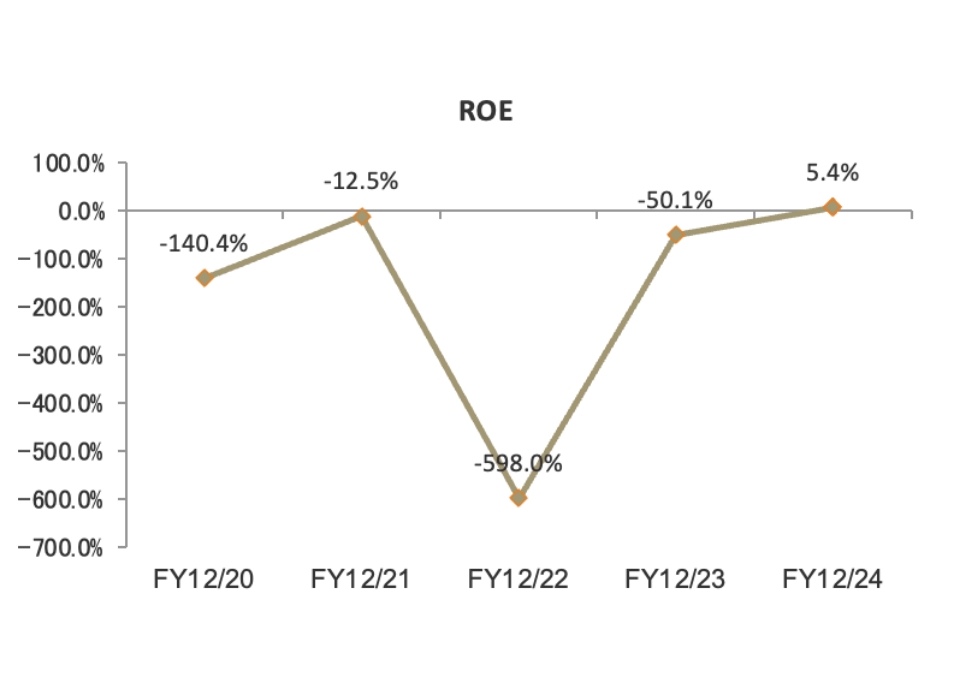
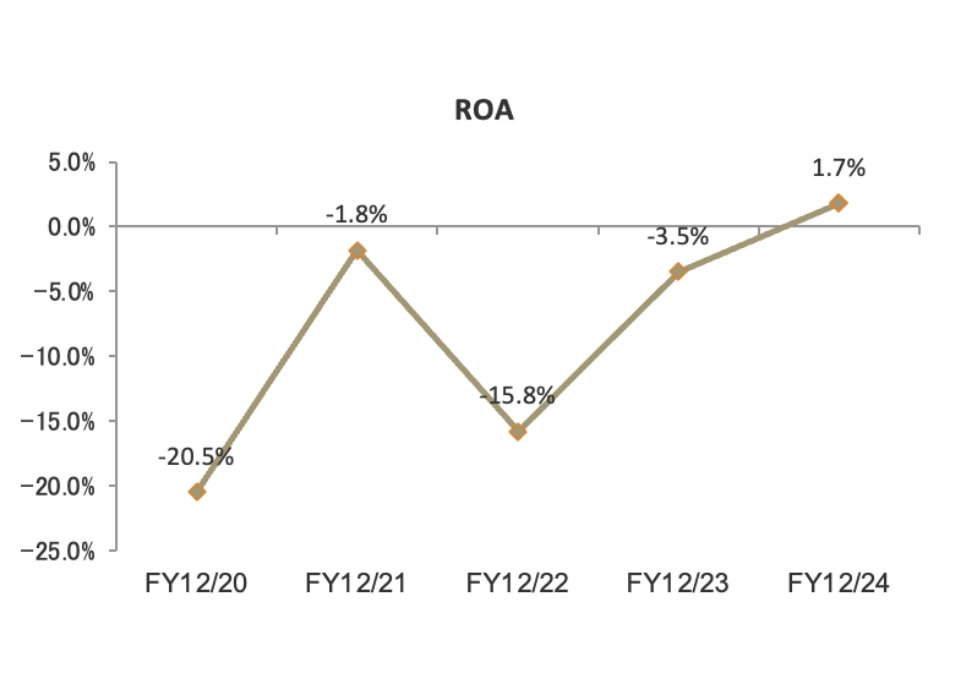
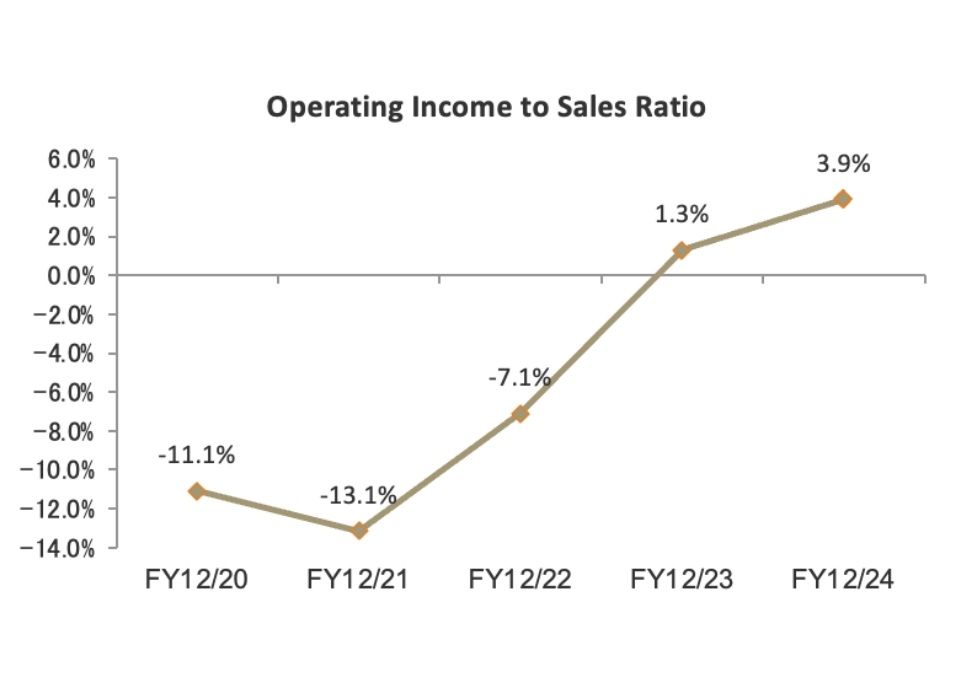
| FY12/21 | FY12/22 | FY12/23 | FY12/24 | FY12/25 | |
|---|---|---|---|---|---|
| Earnings Per Share | -11.23 | -77.21 | -15.71 | 10.03 | 1.76 |
| ROE | -12.5% | -598.0% | -50.1% | 5.4% | 1.0% |
| ROA | -1.8% | -15.8% | -3.5% | 1.7% | 0.4% |
| Operating Income to Sales Ratio | -13.1% | -7.1% | 1.3% | 3.9% | 2.3% |
The information contained within this site is not meant to be a solicitation to purchase our shares. We ask any users of our site to refrain from basing any investment decisions upon our company using the information contained within our site alone.
![]()
![]()
![]()